|
For the week of September 22nd to September 29th 2011
Previous weeks stats in brackets New Listings: 369 (371, 362, 419) Sold: 127 (122, 128, 102) Sale to List Ratio: 34% (33%, 35%, 24%) Expired/Cancelled/Withdrawn: 113 (133, 154, 130) Active Single Family Home: 3126 (3108, 3105, 3117) Average Single Family Home List Price: $272,161 ($274,686, $272,990, $269,956) Average Single Family Home Selling Price: $265,584 ($264, 723, $266,304, $262,839) Average Days on Market - Single Family Home: 108 (96, 90, 92) Active Condos: 375 (380, 378, 364) Average Condo Listing Price: $305,329 ($251,913, $230,373, $258,120) Average Condo Selling Price: $298,670 ($242,846, $224,953, $250,874) Average Days on Market - Condos: 288 (124, 222, 149) So the word of the week this week is Condo's. Not that many sold this week, but the fact of the ones that did sell are well above previous weeks prices and have been on the market for a lot longer. The lack of Condo inventory means lack of choices for buyers looking for the ideal home at the ideal price. With asking prices holding firm, the buyer in this situation has a few choices. Put the offer in at the price the buyer feels comfortable and see what happens, keep a constant watch on the market and snipe the first good deal closest to their needs, or re-evaluate the personal timeline and decide to pull from or invest in the current market. Unfortunatly some buyers do not have time on their side and must choose from the inventory selection. Whats your thoughts? Previous weeks stats in brackets
Click here for the newest blog entry New Listings: 371 (362, 419, 425) Sold: 122 (128, 102, 142) Sale to List Ratio: 33% (35%,24%, 33%) Expired/Cancelled/Withdrawn: 133 (154,130, 269,) Active Single Family Home: 3108 (3105, 3117, 3099) Average Single Family Home List Price: $274,686($272,990, $269,956, $265,809) Average Single Family Home Selling Price: $264, 723 ($266,304, $262,839, $255,650, $265,517) Average Days on Market - Single Family Home: 96 (90, 92, 73) Active Condos: 380 (378, 364, 344) Average Condo Listing Price: $251,913($230,373, $258,120, $225,176) Average Condo Selling Price: $242,846 ($224,953, $250,874, $216,269) Average Days on Market - Condos: 124 (222, 149, 150) The numbers are similar to last week except for condos. Less time on market and higher average prices - good news for condo sellers! Don't forget to check in next Thursday for the new stats! Also, don't forget to vote on the question of the week. If you have any thoughts/suggestions on the question of the week, feel free to leave me a comment.
Last week I posted a poll asking what you thought of the Home Staging service. The results showed that most of you think its a worth while investment overall. Both the "necessary service" selection and "would use it if was free" finished first with only five votes seperating the two. The good news is that the service is becoming more well known as only three people cast the "I don't know what Home Staging is" vote. Personally, I think Home Staging is a must for any listing. I include a free Home Staging Consultation with every one of my Selling Listings to ensure the most positive experience for a Buyers walkthough. First impressions can make or break a sale and Buyers can't help judging everything in your home as they walk through. The more impersonal your home is at the time of selling, the sooner potential Buyers will start picturing themselves there. Whats your thoughts?
Question of the week will be asked Tomorrow. Submit your idea for a chance to be the featured Question of the Week! Market Statistics for the week of Sept 8th - Sept 15th 2011
Previous weeks stats in brackets New Listings: 362 (419, 425,372) Sold: 128 (102, 142, 151) Sale to List Ratio: 35% (24%, 33%, 41%) Expired/Cancelled/Withdrawn: 154 (130, 269, 89) Active Single Family Home: 3105 (3117, 3099, 3157) Average Single Family Home List Price: $272,990 ($269,956, $265,809, $272,464) Average Single Family Home Selling Price: $266,304 ($262,839, $255,650, $265,517) Average Days on Market - Single Family Home: 90 (92, 73, 81) Active Condos: 378 (364, 344, 367) Average Condo Listing Price: $230,373 ($258,120, $225,176, $257,370) Average Condo Selling Price: $224,953 ($250,874, $216,269, $248,360) Average Days on Market - Condos: 222 (149, 150, 117) New listings are down this week and solds are slightly up. Inventory continues its slow decline into the autumn, or "sweet spot" of the market year. Some say time to "cash our chips and pull our listing" around this time of year, others swear by the fall to list their properties. With inventory still selling and Active Listings on the decline, some Sellers take advantage of the gap to "ante up" and gamble on statistical selling. Whats your thoughts? Last week I asked you to send in your crazy, funny and weird sitings at an Open House/Showing. Heres some of the results in no particular order;
10. An Alter/Shrine to Elvis 9. Master Bathroom had a Bee Hive with a load of angry bees 8. A Hangmans Noose in the basement with a chair under it 7. Taxidermied Cats 6. A Three wall painted Mural of the Pee-Wee Herman show....in the living room! 5. A life sized waving Ronald McDonald in the backyard trees 4. A note in a forclosure that read "I'll be BACK" 3. Basement Rec Room that had wall to wall sand 2. Thumping noise coming from INSIDE the Fridge 1. a FIRE If you have anymore to add, send them in and Ill post again in a future blog. Any suggestions for the question of the week? Give me your thoughts. Sept 1st - Sept 8th
Previous weeks numbers are in brackets. New Listings: 419 (425,372, 414) Sold: 102 (142, 151, 130) Sale to List Ratio: 24% (33%, 41%, 36%) Expired/Cancelled/Withdrawn: 130 (269,89, 108) Active Single Family Home: 3117 (3099, 3157, 3167) Average Single Family Home Price: $269,956 ($265,809, $272,464) Average Single Family Home Selling Price: $262,839 ($255,650, $265,517) Average Days on Market - Single Family Home: 92 (73, 81) Active Condos: 364(344, 367, 376) Average Condo Listing Price: $258,120 ($225,176, $257,370) Average Condo Selling Price: $250,874 ($216,269, $248,360) Average Days on Market - Condos: 149 (150, 117) So, after a few technical difficulties and a near heart attack, this weeks stats are finally here! Not many sales again this week continuing the lack of "Buyer confidence" trend. Lots of good deals out there for the savvy investor, or the Home Buyer that has been waiting for their chance to strike. Some innovative ways to market property are key in grabbing the attention of prospective Buyers as the selection of homes increases and the need to "Stand Out" become more necessary. Staging, web 2.0 marketing and keeping up to date with the market trends are now a reality for the Seller looking for an expedient sale. Whats you're thoughts? Aug 25th-Sept 1st
Previous weeks numbers are in brackets. New Listings: 425 (372, 414, 448) Sold: 142 (151, 130, 151) Sale to List Ratio: 33% (41%, 36%, 34%) Expired/Cancelled/Withdrawn: 269 (89, 108, 119) Active Single Family Home: 3099 (3157, 3167, 3148) Average Single Family Home Price: $265,809 ($272,464) Average Single Family Home Selling Price: $255,650 ($265,517) Average Days on Market - Single Family Home: 73 (81) Active Condos: 344 (367, 376, 374) Average Condo Listing Price: $225,176 ($257,370) Average Condo Selling Price: $216,269 ($248,360) Average Days on Market - Condos: 150 (117) Expired listings spike this week with unsold summer listings coming off the market and back to school looming for most. Residential inventory, makes its slow decline coinciding with the weather. At least August went out in style! Question of the week has been moved to Mondays (after this one) What's the weirdest thing you have seen at an Open House/Showing? 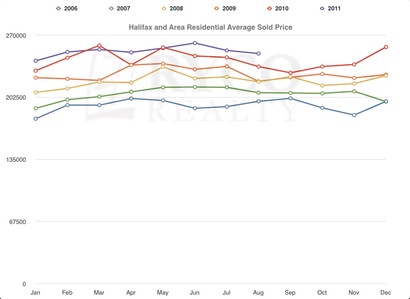 The Average Sold price in HRM held its increased value over the previous years by its usual percentage and followed its downward trend indicative of this time of year. 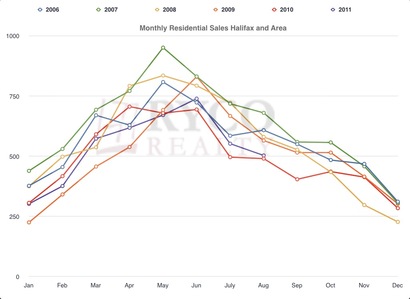 Monthly sales hit another monthly low just above last years numbers but still below the previous 4 years showing a continued lack of Buyer confidence in the market. 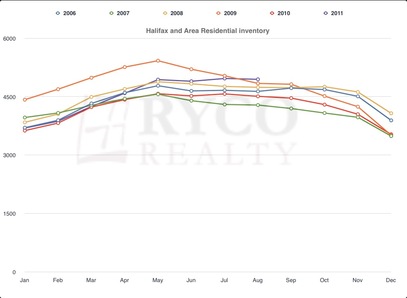 Residential inventory remians higher than the previous years with no clear signs of reduction anytime soon. So sales are down, inventory is up and the price of sold homes is up. What does this mean? I think it means that Buyers are taking their time and exhausting all potential homes, completing their Due Diligence, educating and better preparing themselves for their home purchase. Sellers are holding out for their asking price, following market trends and holding confidence in their homes. Educating themselves and waiting for the right buyer. Typical behavior associated with "Buyers Market".
|

Jeremiah Wallace, CDJeremiah has been involved with many aspects of the Real Estate industry for over fourteen years. This includes construction, residential renovations, interior design, and investing in various income generating property products.. ListingsPhoto's by Jeremiah
Archives
April 2024
Categories
All
|
 RSS Feed